When it comes to day to day Linux administration tasks, being able to efficiently monitor system performance is critical to ensuring your servers are operating at their best.
Thankfully Linux includes a range of packages to make keeping track of system stats easy, but some can often leave you confused or unsure about how to interpret the results.
This article aims to dive into some of the key tools, how they work, and how they can help. For this guide we're including memory usage, CPU load, disk I/O, and file system utilization as our key metrics.
freeLinux's memory management might initially seem perplexing due to its aggressive utilization of available memory for buffers and cache.
The built in free command often makes people think they've got less free memory due to how the memory stats are provided. This isn't necesserily an issue in the command itself, but more of a misconception as to how Linux memory management works.
By focusing on the "available" memory, you get a clearer picture of your system's memory status, as Linux dynamically uses free memory for buffers/cache, making the "free" value often appear misleadingly small.
Typically most of what is occupied in the Buffers/Cache section is freeable memory, and it's only being used because it's available. As soon as a process needs that memory, it's made available, hence why it counts towards the total available memory on the system.
free -m
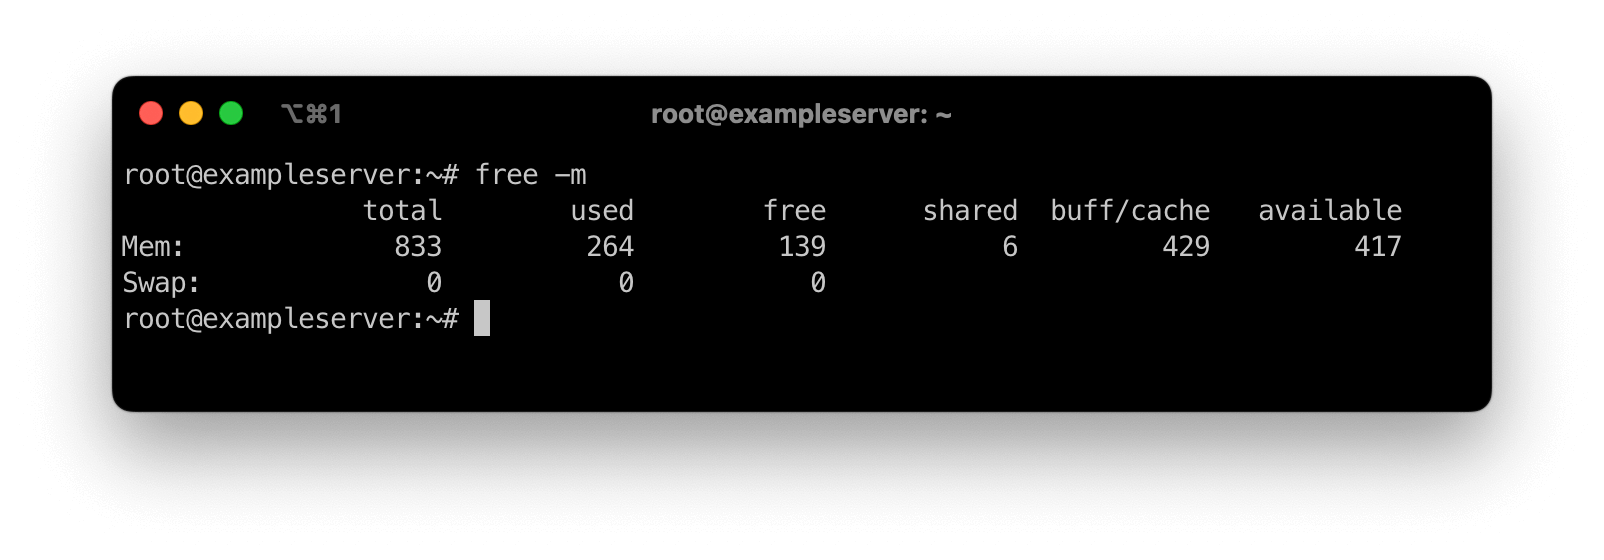
This showcases memory usage in megabytes, providing a clearer view of your system's memory status beyond just the "used" and "free" values.
As you can see in our screenshot, whilst we have 139 megabytes free, our total usable memory is actually 417 megabytes, as the system has calculated that some of the 429 megabytes being used for buffers and caches can be freed up as needed.
top and htoptop commandtop command serves as a dynamic real-time monitor for system processes and their impact on CPU and memory.
top
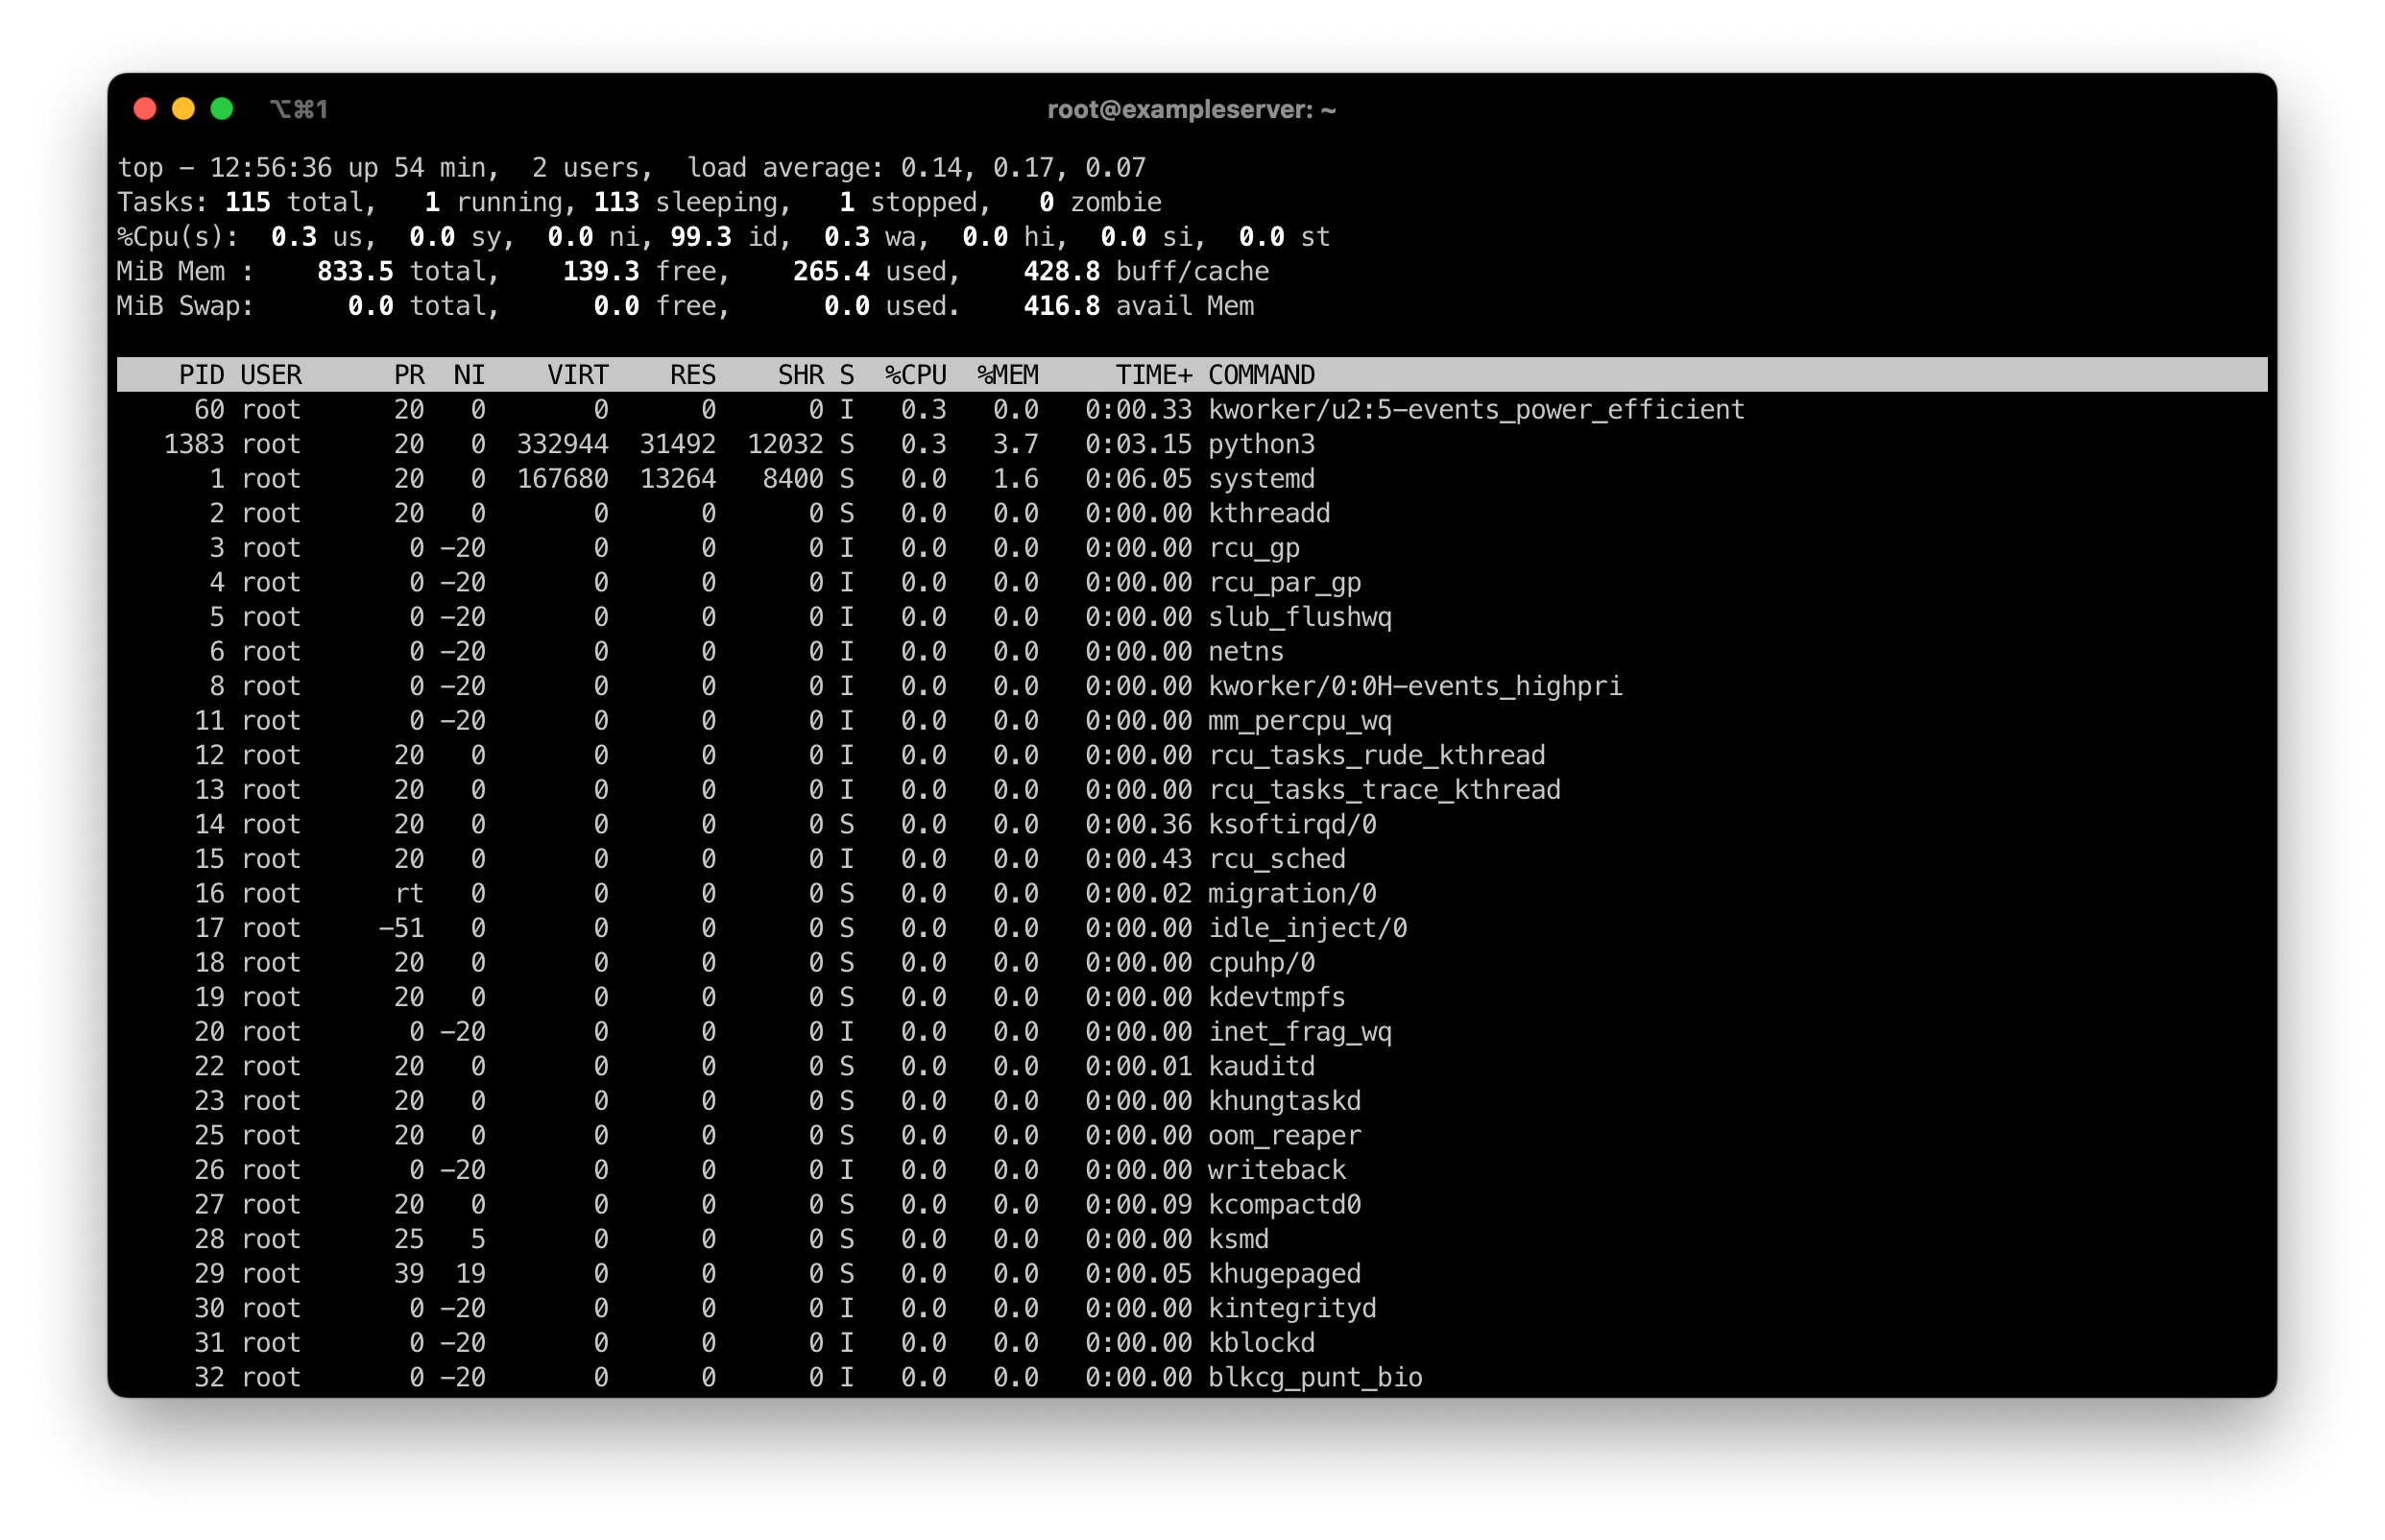
Top is included out of the box with most modern Linux distributions, and provides a basic overview of your systems performance, covering the current load averages, CPU usage, memory usage and a list of runnning processes. Unlike htop which we'll cover below, this is not an interactive output and doesn't allow you to sort the list of processes or search through them. In many environments top has been replaced with htop due to its improvements and flexability.
htop command, and why it's superior.An enhancement over top, htop provides a more accessible and visually appealing interface to process monitoring, along with improved interaction mechanisms.
Installation:
htop might not be pre-installed on some older systems. Thankfully installing it is as simple as a one line command with your package installer.
If you're on an Ubuntu or Debian based Linux distribution this can be done like so:
sudo apt install htop
If you're using Rocky Linux, Alma Linux, Fedora, CentOS or another RedHat based distribution then you can install it using your package manager, be it Yum, DFU or any other.
Usage:
Simply type htop in your terminal to launch it.
htop
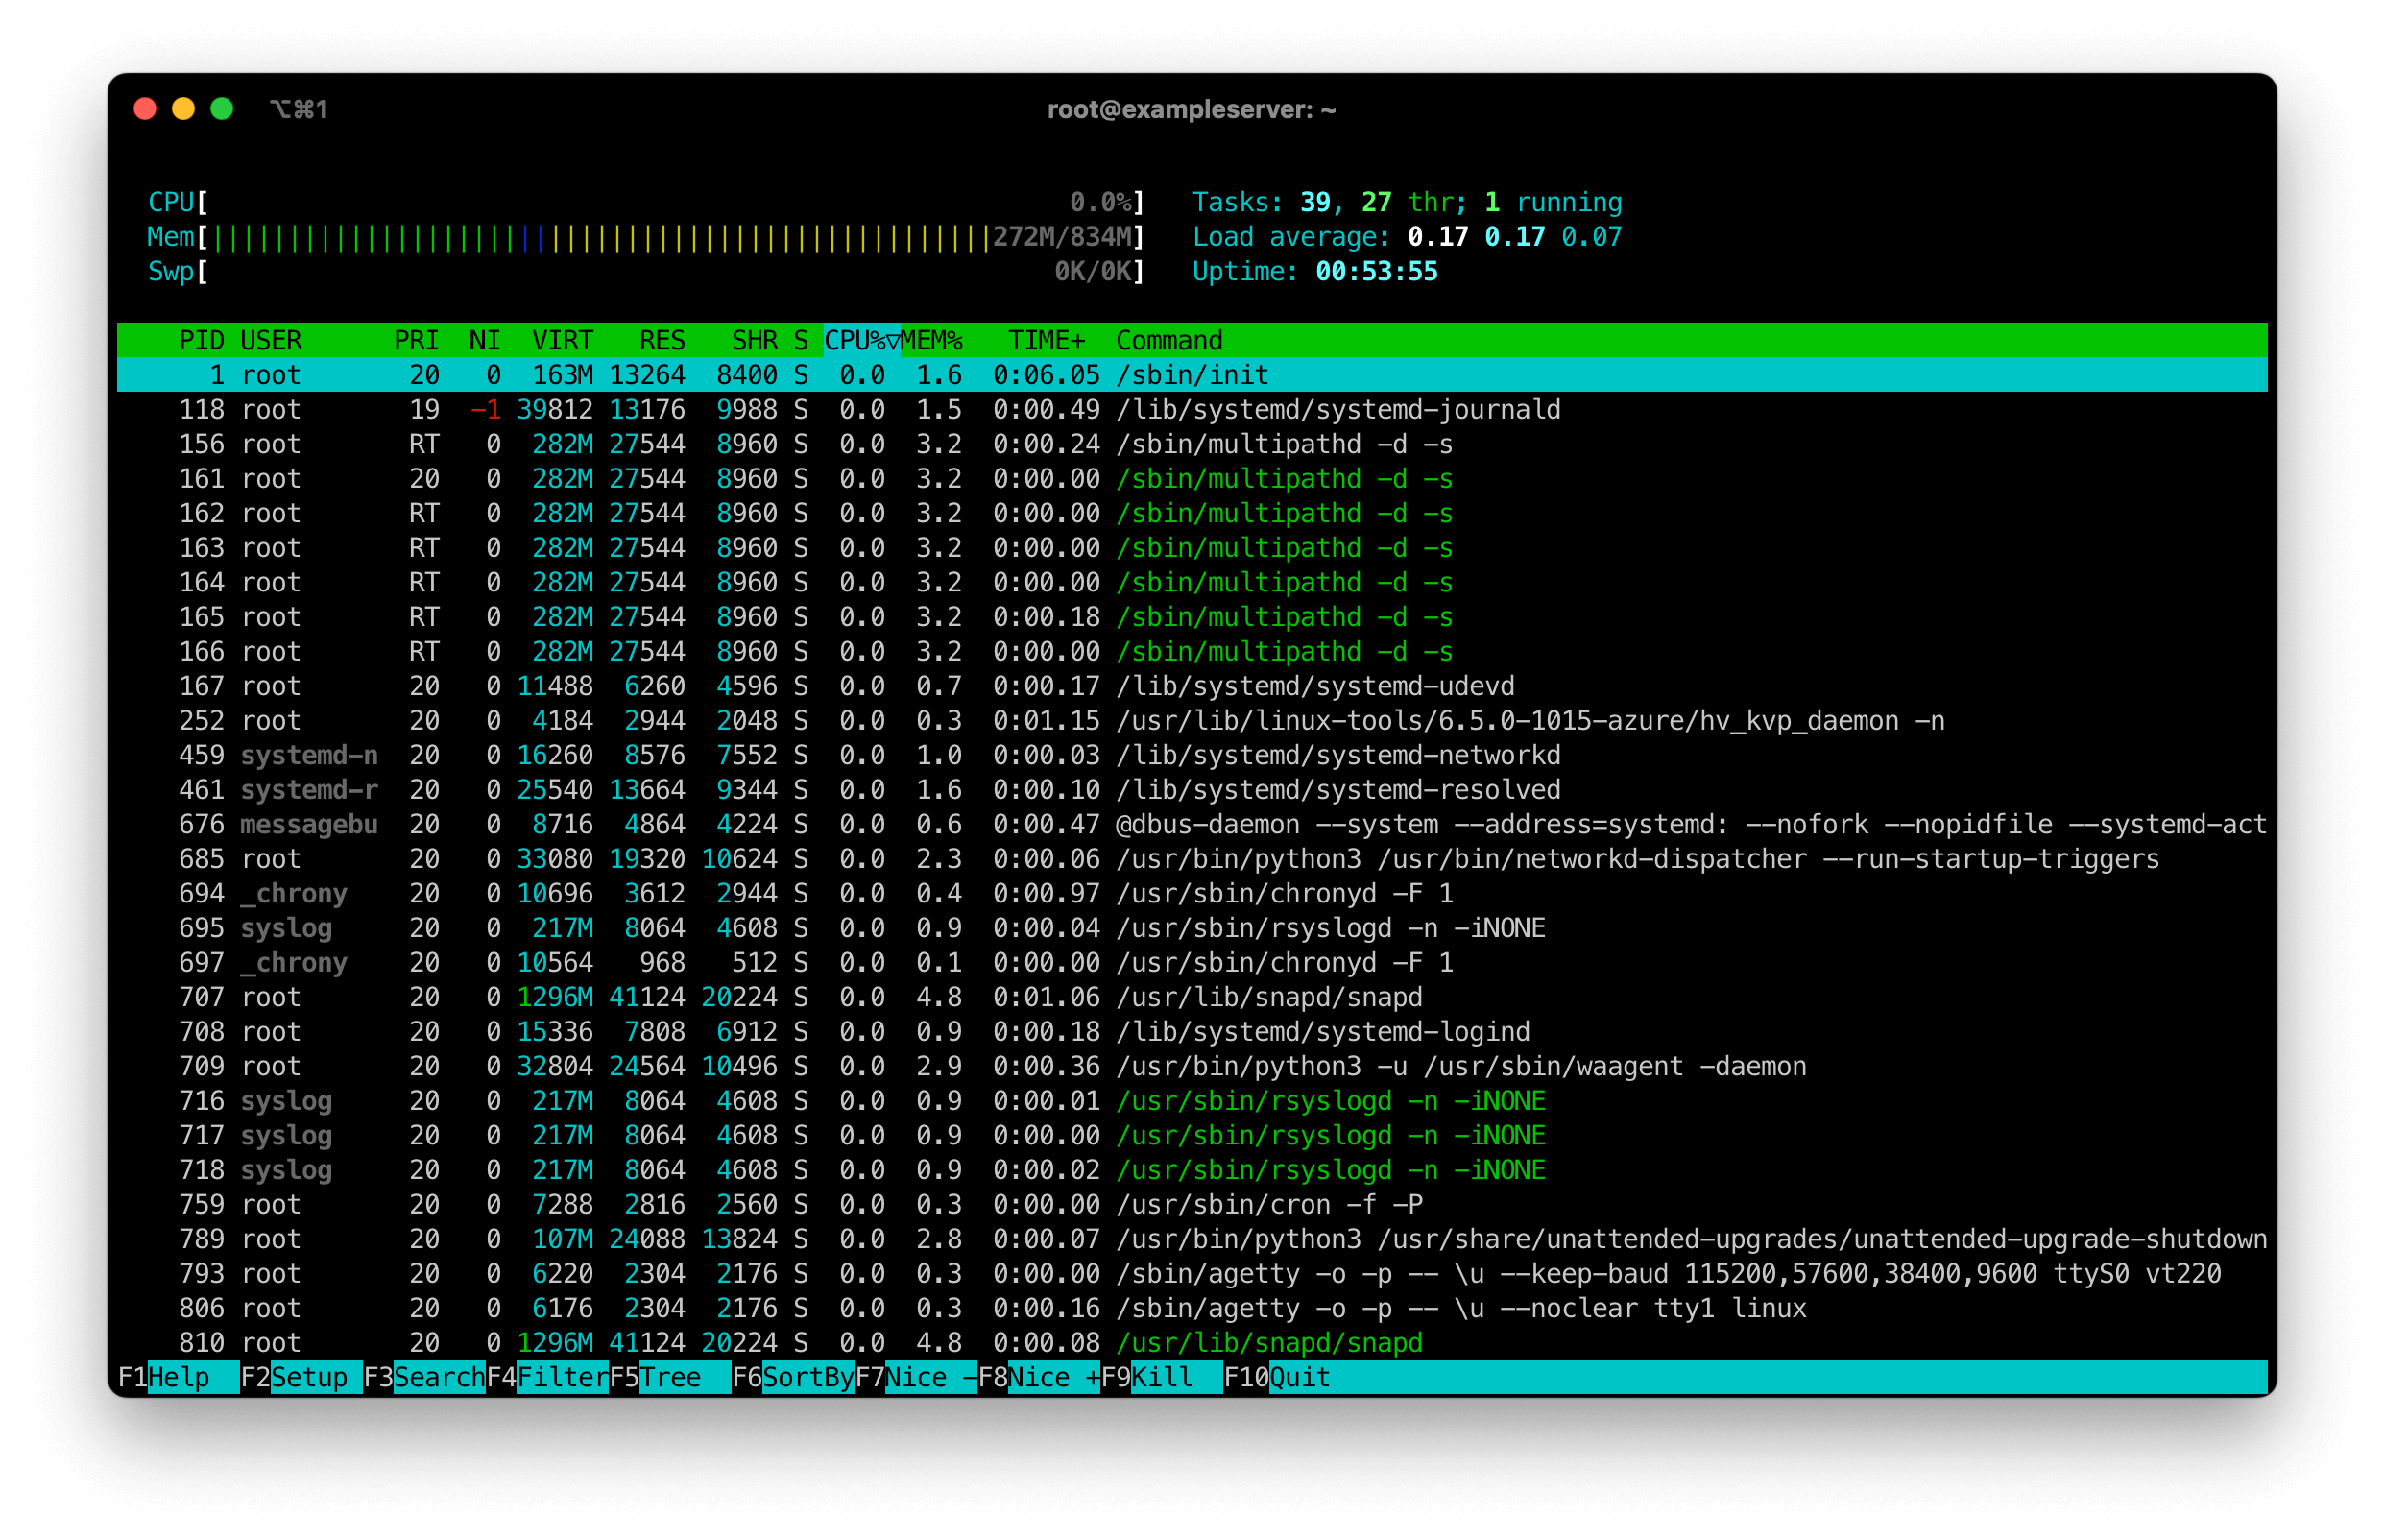
As you can see comparing the above htop output to the standard top output, you get a much easier to read display of events. Whatsmore, with htop you can click on the headings to sort the process list by usage (be it CPU, Memory, etc).
Unlike top, htop also includes the ability to search and filter through the results, making it easy to hunt down a specific process to see how it's performing on your server.
iostatDisk I/O performance insights are crucial for diagnosing system sluggishness related to disk usage patterns.
The iostat command on Linux is a system monitoring tool that provides information about input/output (I/O) statistics for block devices (like hard drives and SSDs) and CPUs. It can be used to analyze the performance and usage of these resources on your system.
The iostat command is distributed as part of the sysstat package. Depending on which Linux distro you are using you may need to install this using your package manager.
First, ensure you have sysstat installed. If you're on an Ubuntu or Debian based Linux distribution, this can be done by running the following apt command:
sudo apt install sysstat
For Rocky Linux, Alma Linux, CentOS, Fedora etc then you'll also be able to install it using DNF or Yum.
Then, run iostat:
iostat
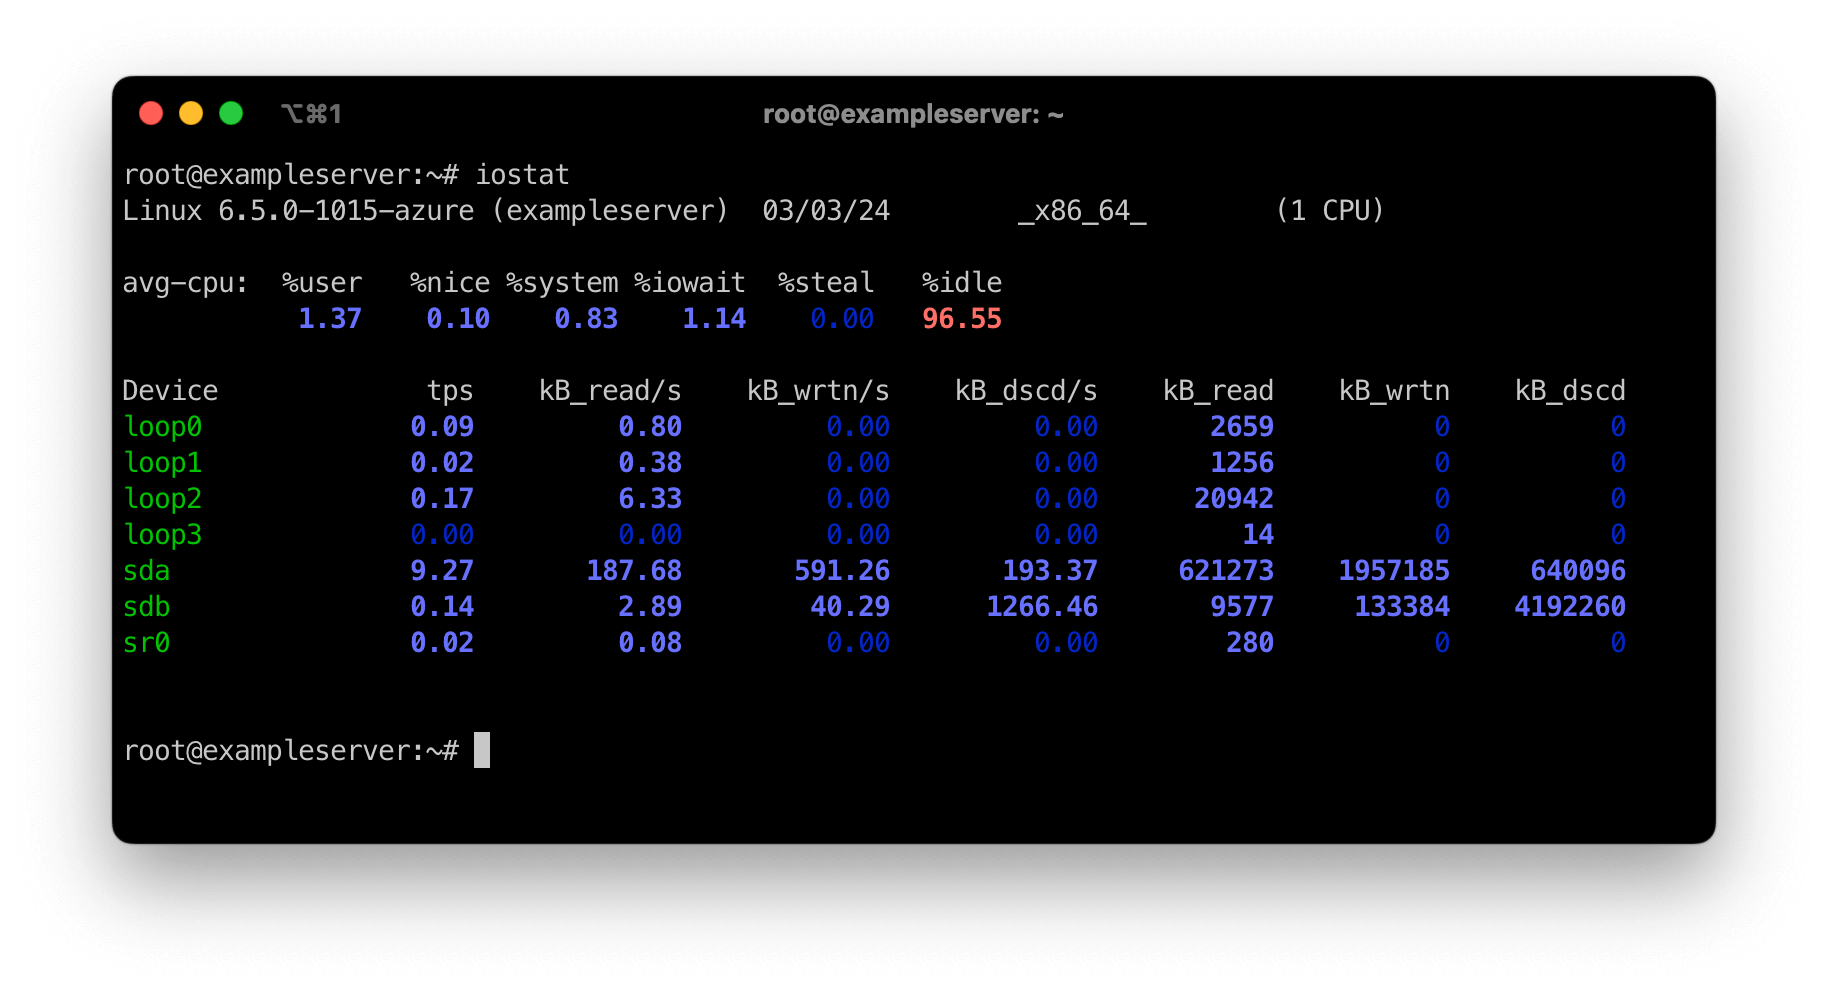
The iostat command is invaluable for identifying disk I/O bottlenecks. It provides detailed statistics about disk read/write operations and can help pinpoint inefficient disk usage patterns.
vmstatThe vmstat command in Linux is a powerful tool used to display various statistics about virtual memory, system processes, CPU usage, I/O, and system resource utilization. Its name stands for "virtual memory statistics."
vmstat provides real-time information about system performance and can be valuable for diagnosing performance issues and monitoring system health.
Run with a 1-second interval for continuous monitoring:
vmstat 1
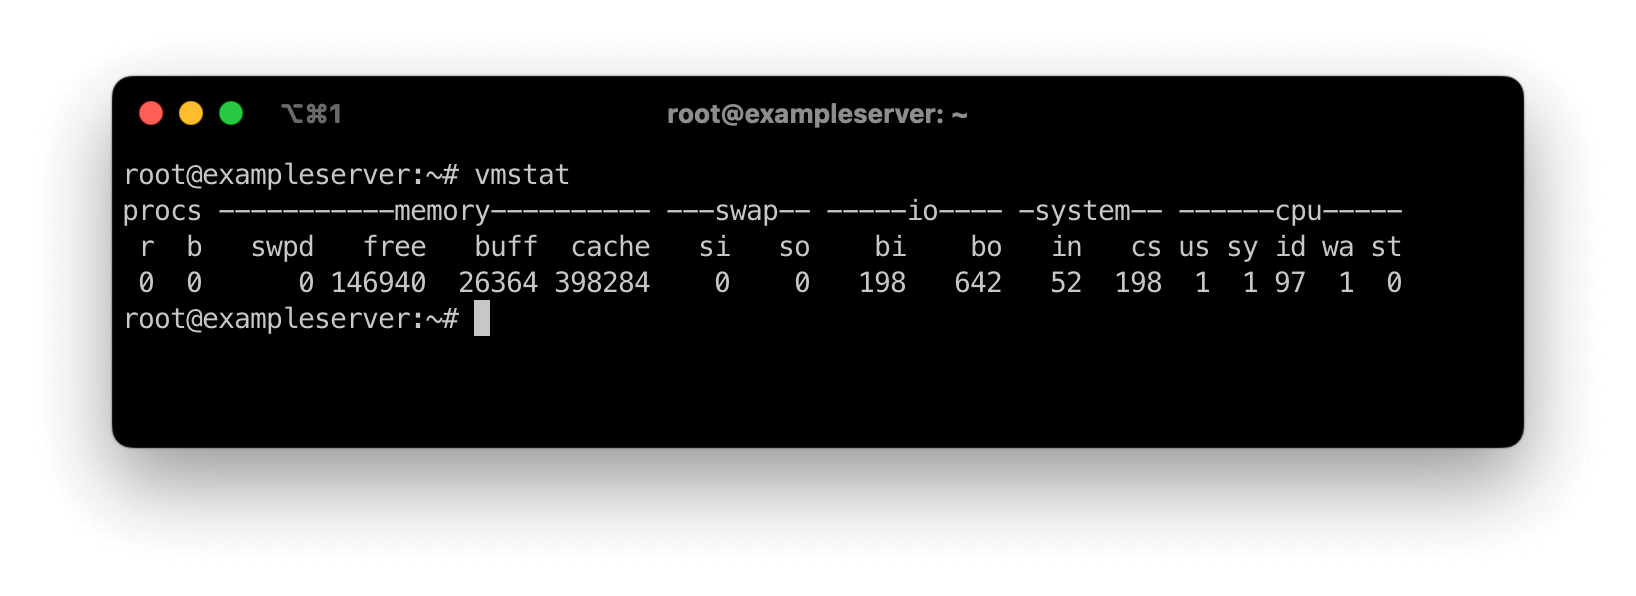
vmstat supports various options to customize its output. Some common options include:
dfThe df command in Linux is used to display information about the disk space usage of filesystems.
Its name stands for "disk free." df provides details about the total disk space, used space, available space, and filesystem type for each mounted filesystem on the system.
df -h
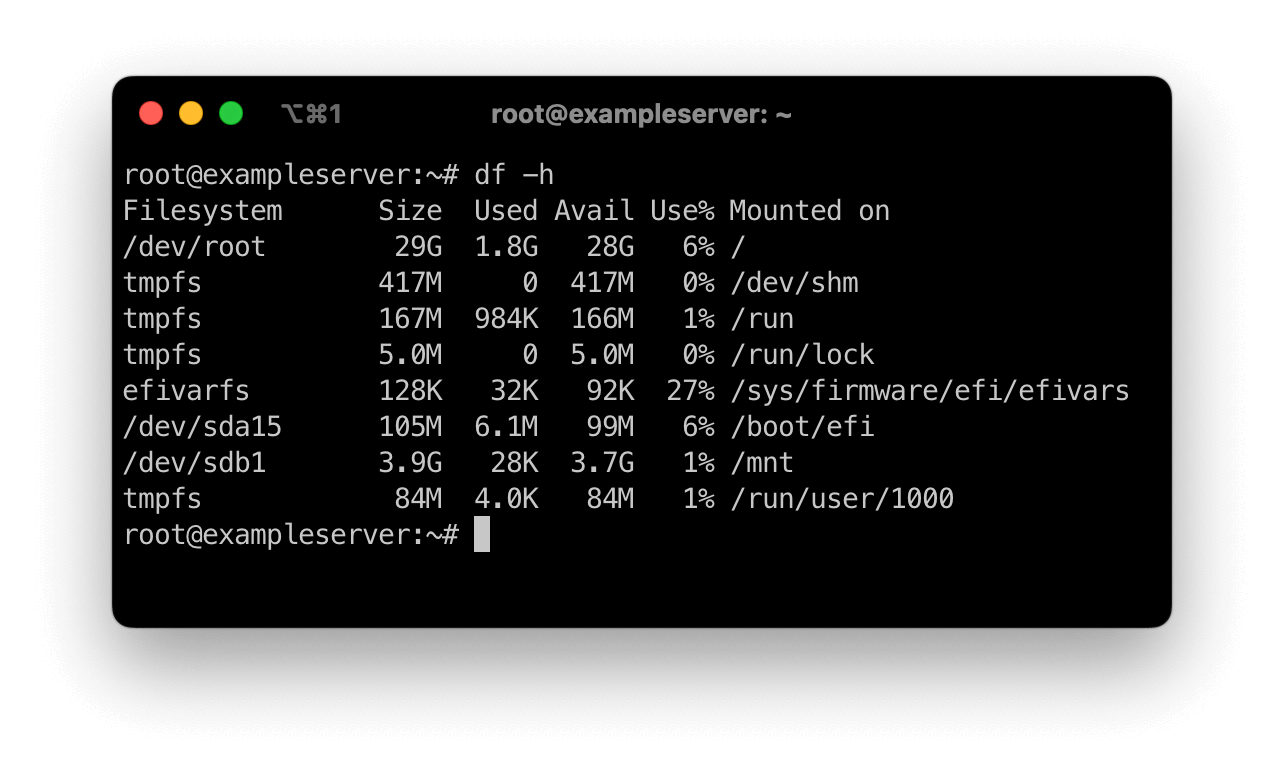
Options:
df supports various options to customize its output. Some common options include:
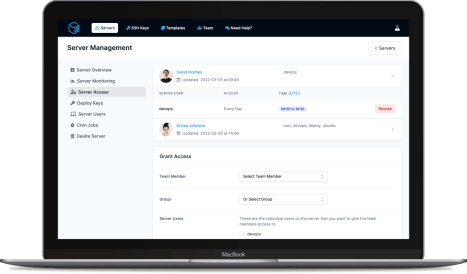
While the commands detailed above are indispensable for in-depth system analysis, ServerAuth provides a unified monitoring dashboard that compiles critical metrics like CPU load, memory usage, and disk utilization. This integration means you can keep tabs of server health at a glance, ideal for environments where quick oversight and minimal complexity are preferred.
The monitoring capability within ServerAuth extends its utility beyond SSH access management, server access control and website management, presenting a comprehensive tool for ensuring your Linux servers are operating as intended. Remember, effective server management is as much about proactive monitoring as it is about resolving issues post-detection!
Combining the granular insights provided by Linux's native commands with the high-level overview from ServerAuth's monitoring feature forms a robust approach to system performance monitoring. This blend of tools empowers system administrators to not only quickly identify and act on immediate concerns but also to maintain ongoing vigilance over system health, ensuring optimal operation across Linux environments.
ServerAuth provides a whole host of management tools, from controlling who can access your server, to managing your website deployments. And with an ever-growing suite of tools you'll always be one step ahead!
Start for free