Over the last few months we've been working on providing a way to log and keep track of key server metrics, and today we're thrilled to finally be able to show this off to you.
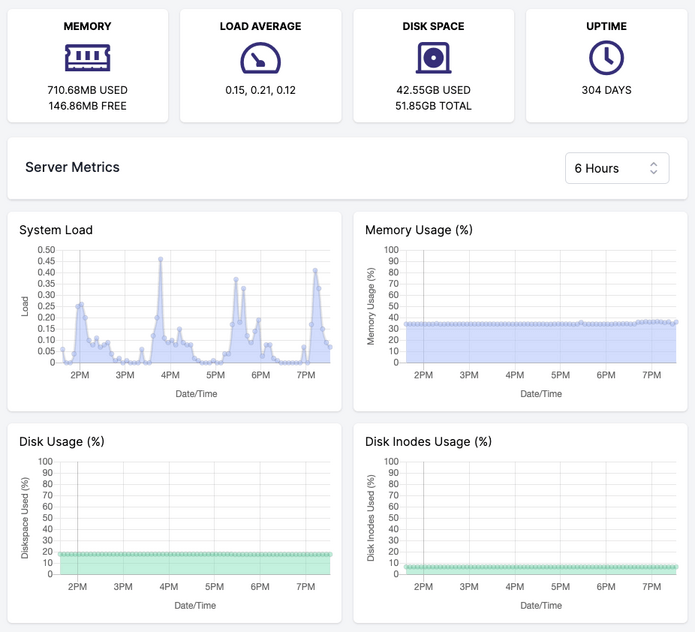
Server Monitoring provides you with a new dashboard inside your ServerAuth account where you can see real-time statistics for your server, showing your system load, memory usage, and more.
The statistics are shown on easy to read graphs, which can be filtered to show statistics from the last 30 minutes, hour, day all the way up to 14 days.
We provide four graphs on the dashboard, which provide a 14-day view of:
Above this are some handy stats including:
As part of this new update, we've launched version 2 of the ServerAuth agent, which adds support for server monitoring. If you already have servers set up and using an older version of the agent, your account will provide instructions on how to update, with a unique upgrade command for each server.
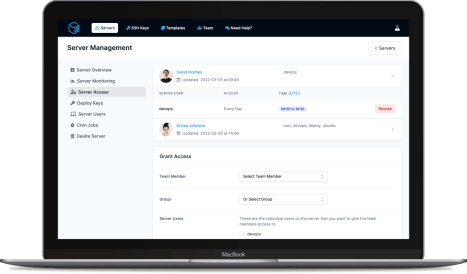
Server Monitoring is available right now to customers on our paid plan and at no extra cost! To get started with it, head over to your servers Manage page and select the new Server Monitoring link on the sidebar.
ServerAuth provides a whole host of management tools, from controlling who can access your server, to managing your website deployments. And with an ever-growing suite of tools you'll always be one step ahead!
Start for free